
Interactive chart: How Europe can replace Russian gas – and what it would cost Russia and EU28
by Michele Peruzzi, Erik Dale and Georg Zachmann on 24th March 2014
Based on interactions with various stakeholders we updated several figures on March 25th (you may need to clear you cache for the changes to be reflected in the chart below).
- Increasing imports from North Africa by 15 bcm will be difficult, as existing pipeline capacities to Italy are fully used already, while increasing exports to Spain will not be helpful, as no additional gas can be brought from the Iberian Peninsula to the rest of Europe. We adjust our estimate to 5 bcm.
- The numbers for district heating gas consumption were largely overstated. We correct the corresponding numbers to 10 bcm. As it is anyway the most expensive option, it would have only been selected as a last resort.
- Switching district heating from gas to oil in the import constraint countries Finland, Latvia and Estonia is, however, possible. Switching in Lithuania seems to be more difficult. Here, in the short term other options need to be developed. In the medium term Lithuania will install a floating LNG regasification terminal to allow gas imports from international LNG markets.
- Increasing production in the Netherlands is technically possible, possibly much more than the 20 bcm we put. However, the Dutch government might be quite reluctant to allow even 20 bcm of additional production, as it just issued legislation to reduce production in order to control the gas-production induced seismic activities. So it is a question of political will and compensations. Hence we stick to the 20 bcm/y.
- Power production from natural gas plays an important role in the UK and Italy. It will not be possible to fully replace those plants, given the lack of alternative capacities. We corrected the potential gas savings from 60 bcm/y to 40 bcm/y.
- With these adjustments, we conclude that up to 190 bcm of alternative supplies might be available for the coming year.
Last week, we analysed whether Europe could replace Russian gas, and we identified some options for Europe to do so. These included importing natural gas from other sources or increasing domestic production.
But how much would these options cost Europe and Russia? How do these options play together? Is there a preferred alternative, or perhaps there is an optimal policy mix? We try to answer these questions in the simulator below, computing the impact of different options.
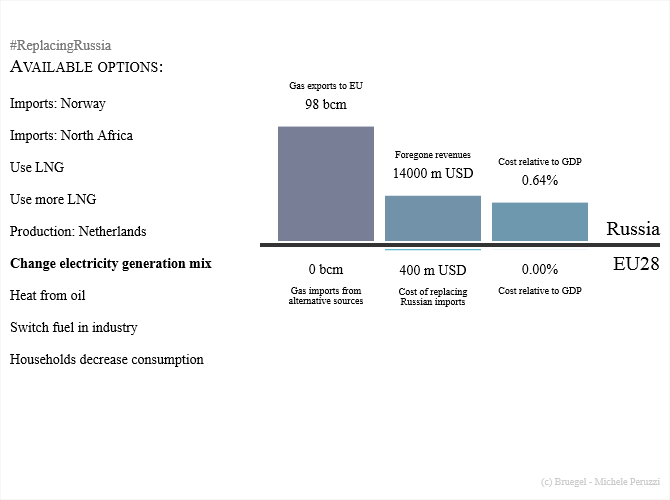
The chart is interactive: to display a scenario relative to a particular mix of alternatives, select all the desired options on the left. An alternative can be deselected by clicking it again. A small description of every option can be found below the chart by hovering the mouse over its label. The values of the exports, imports, and the cost of the selected mix are always calculated on the basis of their relative cost. This means that the most expensive selected alternative will only be used up to the point of zero imports from Russia.
You can also save the chart in its current state by clicking the button below. Share your preferred mix of alternatives with @Bruegel_org by using the hastag #ReplacingRussia.
Note: the figures should not be taken as a detailed and complete estimate of the costs of adopting a certain mix of alternatives. This chart is meant to show the relative interplay among the alternatives, and to make simplified comparisons.