Market coupling does not lower prices!
by Georg Zachmann on 24th September 2012
Market coupling is one of the key-policies for achieving the EU single electricity market. The EU Commission praises the price-lowering effects of market integration in the first draft of the Internal Market Communication of August 30th: “wholesale electricity prices in the EU have risen much less thanks to competition facilitated by increasing cross-border trading and market integration”.
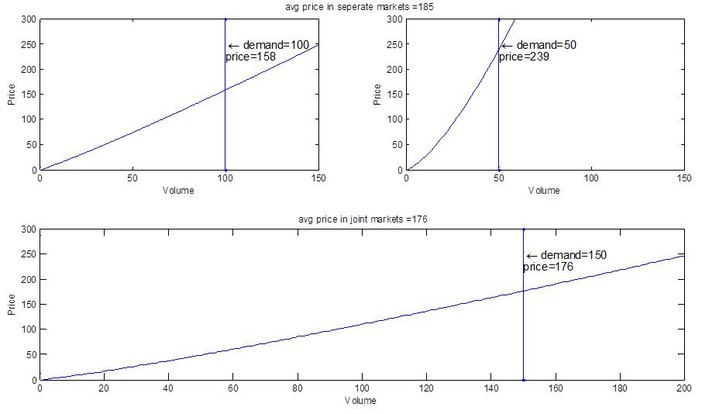
And common sense would indeed suggest that in competitive markets the average price of two market zones will be equal or lower when they are coupled than when they are separate. In fact, coupling should lead to lower average prices for typical electricity markets (increasing marginal cost on the supply side and price-inelastic demand). The intuitive reason is that the most expensive MWh in the expensive country might be replaced by switching on one additional MWh in the cheaper country. As marginal cost is increasing the switched-off MWh will be disproportionally more expensive than the switched on MWh. In our example (see Figure 1) in the first market 10 MWh with marginal cost of 158-176 EUR are switched on while 10 MWh with marginal cost of 176-239 EUR are switched off.
Figure 1: Market coupling with well behaving cost functions under perfect competition

In a Cournot competition setting this effect is amplified by the increase in the number of players in the joint market. This increased competition in the joint setting will drive down prices compared to the separate market setting. In our example (see Figure 2) coupling two monopolistic markets (with similar cost curves) to one duopolistic market drives down the average price by 7 percent.
Figure 2: Market coupling with well behaving cost functions under imperfect competition


The above illustrated supply curve smoothing and competition enhancing effect of market coupling would suggest, everything else being equal, that consumers in two markets in total face lower electricity bills when the markets are coupled, then when they are not.
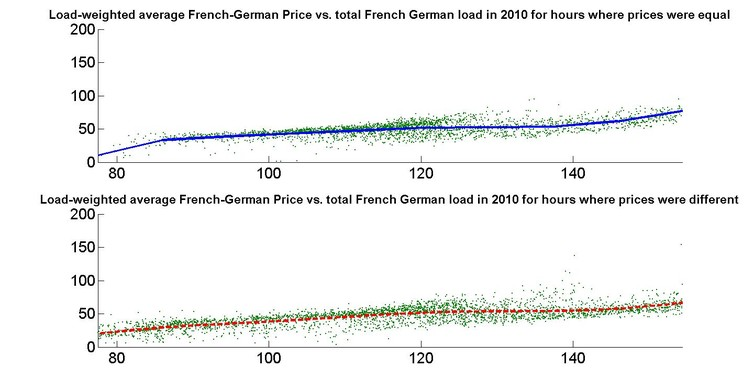
We now move on to test this important proposition empirically using European spot electricity prices. The hypothesis is that at a given total demand in the two markets, average prices are typically lower when the markets are coupled than if they are decoupled. In Figure 3 the relation between load-weighted average prices (in €/MWh) in the Franco-German market and total volume (in GWh) in the Franco-German market is depicted (green dots). Thereby, the upper subplot only plots the instances were electricity prices in both countries are close to equal (price difference less than 5%) while the lower subplot restricts the sample to hours where the prices were differing by more than 5%. To make the subplots comparable the polynomial approximation to the volume-price relation has been depicted in both cases as a line.
Figure 3: Weighted average Franco-German price for coupled and decoupled hours in 2010
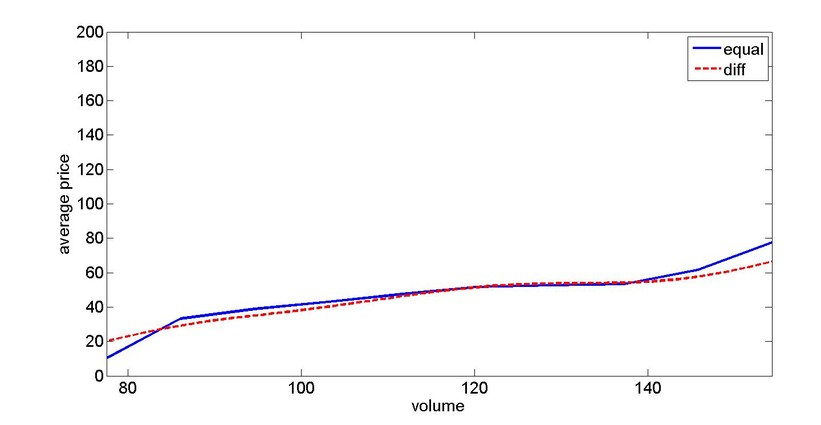
In Figure 4 the prices in both cases are compared. Based on the flattening supply curve and the competition effect one would expect that the red line that represents the average price when markets are decoupled is systematically higher than the blue line that represents the average price when markets are coupled (the lines are polynomial approximations to the price/volume curve). The surprising result is that price equalization (coupling) does only lead to a slightly lower average price at very high levels of electricity demand for the depicted Franco-German case.
Figure 4: Comparison of the weighted average Franco-German price for coupled and decoupled hours in 2010
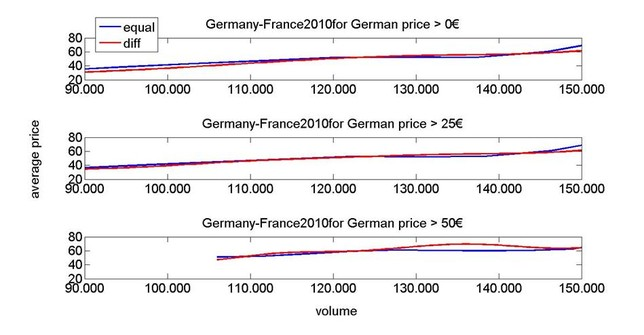
This finding can be reproduced for many years and country combinations (see Figure 5). The only exception from this rule was the Germany-Nordic market combination in 2008 that featured significantly lower prices when the markets were coupled, than when they were not. Results are also not sensitive to the difference threshold. The figures for the 1% and 10% threshold for all 12 cases are suggesting no systematically higher price in case of decoupling like the here reported 5% threshold results.
Figure 5: Comparison of the weighted average prices for coupled and decoupled hours in various European markets

The presented findings are still very preliminary. If they can be confirmed more generally they would point to the conclusion that market coupling is much less beneficial for final customers than one might have expected. In this case, identifying the reasons why market coupling does not drive down prices is required to be able to reap the full benefits of market integration for consumers.
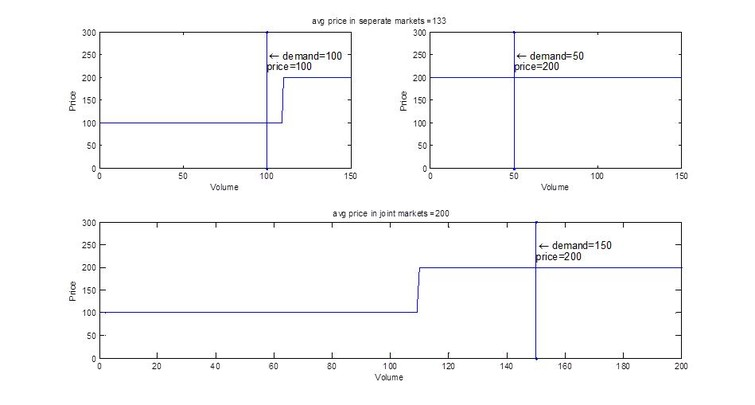
One possible explanation could be the sometimes unusual shapes of electricity cost curves (compared to microeconomic textbook cost curves). When moving to a cost function with a long flat left that become very steep at the right end the above outlined proposition that market coupling leads to lower average prices (due to the flattening supply curve and the competition effect) does not need to hold anymore. As illustrated in the below example (see Figure 6) the price might converge to the higher price when the more sizable low price zone is forced to accept higher prices due to coupling. More research on under which conditions to expect rising/falling prices from market coupling is necessary. This possibly needs to involve supply function equilibria to address the effects of oligopolistic competition in market integration.
Figure 6: Market coupling with non-linear cost functions under perfect competition
Just to be clear, the presented findings do not challenge the view that coupling markets is welfare enhancing. In all presented simulations, total welfare after coupling is larger or equal than in the uncoupled case. The results do also not allow deductions on additional benefits of market coupling such as potentially reduced volatility. So the sole finding I would like to put up for discussion is that market coupling might not have reduced average wholesale prices and hence did not increase consumer rents. I would encourage all readers to enlighten me on what might have caused this finding that was completely contrary to my prior expectation.
PS
Figure 7
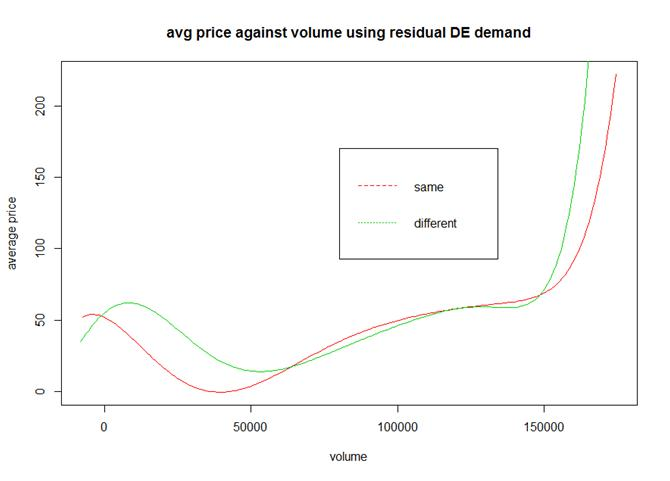
Figure 8